TB-7841 · REV E · Technical newsheet
Design EngineeringDevice profile
Global Factory Output Grows 3% — and Process Capability Breaks
Global factory output grew ~3% annualized in July 2026, the fastest since 2021. Quality engineers must treat every ramp as a process change requiring revalidation.
By Grace Kim3 min read688 words
Features
- Global manufacturing production rose ~3% annualized in July 2026 versus a ~2% long-run average (S&P 500 data).
- Q2 2026 saw the largest quarterly global factory production increase since Q2 2021.
- Europe recorded its strongest manufacturing expansion since 2022.
- Original Gage R&R studies may no longer describe the measurement system after ramp-up adds inspectors, gages, and shifts.
- Pooling two capable suppliers can create a mixture distribution that increases downstream variation.
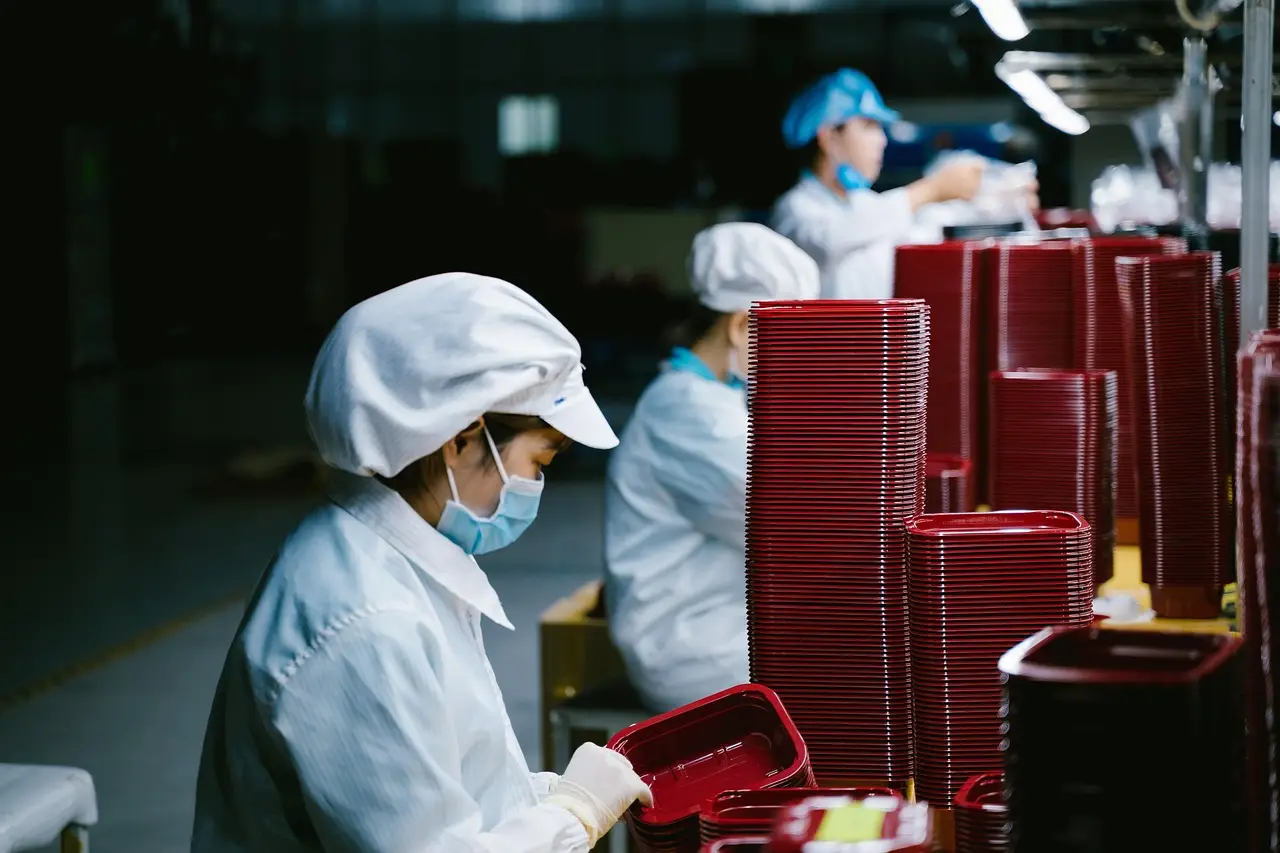
Worldwide manufacturing production expanded at an annual rate of roughly 3% in July 2026, half a percentage point and more above the long-run average of about 2%. For quality engineers, that single number signals a threat: a process that made 1,000 good parts per day is not automatically the same process when asked to make 1,500. The authors of the analysis are blunt about the objective: "The objective isn't to maximize production. It's to maximize good production." By Grace Kim.
What changed in mid-2026?
The data comes from S&P 500 July figures. The second quarter of 2026 delivered the largest quarterly increase in global factory production since Q2 2021. Europe posted its strongest manufacturing expansion since 2022, and technology and machinery ranked among the world's fastest-growing manufacturing sectors. S&P Global also reports that precautionary inventory building is moderating while new orders keep rising, so factories must now satisfy real demand rather than replenish stockpiles.
Every one of those figures lands on the quality department. The takeaway: growth is real, measured, and it changes how processes behave.
Why does a ramp-up change the process?
The article enumerates the concrete mechanisms. Manufacturers add shifts and hire new operators. Machines run longer, and preventive-maintenance windows shrink. New suppliers get qualified, and tooling wears faster. Changeovers increase, alternate materials may appear, and cycle times get challenged. Management, meanwhile, focuses on getting product out the door.
The recommendation is categorical: treat a significant production ramp as a potential process change, not merely a volume change. The takeaway in plain words: more output means a different process, and a different process needs new evidence.
Which statistical tools still work?
Don't use Cpk in isolation. Cpk tells an engineer how capable a process is of producing output within specification limits while accounting for centering. The article warns that using Cpk without control charts, without examining the difference between Cpk and Ppk, and without stratifying Cpk by shift can mislead an engineer into thinking everything is fine while a problem bubbles under the surface.
Track leading indicators. First-pass yields beat final-pass yields, which can use rework to mask underlying quality issues. Statistical process control reveals process behavior before outcomes are impacted. Machine monitoring shows whether production staff is changing the process to accommodate higher throughput.
Revalidate the measurement system. Ramp-up changes measurement too — new inspectors, operators, gages, machines, and shifts. The original Gage R&R study may no longer describe the measurement system actually in use. When someone asks "can we run it faster?", changes to line speed, feed rate, cooling time, or cycle time fundamentally change the process. The article prescribes Design of Experiments (DOE) over trial and error, because DOE accounts for interactions among all factors.
The takeaway: capability indices, SPC, Gage R&R, and DOE each answer a different question about the ramped-up line.
How do second suppliers add variation?
When a primary supplier cannot keep up, adding a second supplier creates what the article calls a mixture distribution. The downstream process then experiences more overall variation — even though neither supplier is necessarily bad. Statistical analysis helps here: hypothesis testing can stratify incoming material by supplier, and DOE can uncover interactions between the supplier and other process factors. The takeaway: pooling capable suppliers can still degrade output, so the statistics must catch it.
What should engineers ask for now?
The article closes with a resource argument. Manufacturers still face elevated costs, supply disruption, and extraordinary uncertainty, but higher output should translate into higher revenues and profitability. That makes a ramp-up the right moment to request investment in the quality program. For teams uncomfortable with statistical analysis, vendors and consultants offer solutions, services, and training.
The final advice is practical. If pushed by a CFO or production lead — and lacking the energy to explain process variation — reply with the article's own title: "When Manufacturing Ramps Up, Quality Cannot Be Allowed to Ramp Down." The open question for every plant ramping in 2026: can you statistically prove the new process still makes what the customer expects?
via bnpmedia.com (Original)
Filed under
- process-capability
- statistical-process-control
- gauge-r-r
- design-of-experiments
- manufacturing-ramp-up
More from Grace Kim
Show full bio
Correspondent covering companies, deals and strategy in Instruments, test and measurement at Testbench Report.
95 articles
Application notes
- SEMI Forecasts 300mm Fab Equipment Spending to Reach $227 Billion by 2029
- US Test Equipment Market to Reach $19.8B by 2031 at 7.1% CAGR
- VDMA Forecasts 3% Growth for Europe's Machine Vision Market in 2026
- AI Chip Demand Drives Record Profits for Taiwan Test Equipment Makers
- ISO 9001:2026 lands as metrology pushes onto the shop floor